 WhatsApp
How to measure an organic creator campaign without inventing ROI
Start with the decision your report needs to support. A practical guide to recording attention, audience questions and trackable actions without overstating what they prove.

A creator campaign can finish with plenty of screenshots and still leave the team unsure what to do next. Should you repeat the concept, explain the product differently, or improve the page people reach after watching? Useful measurement starts with that decision, before anyone builds a dashboard.
Here, organic means content distributed without buying advertising placements. Production, products and coordination can still cost money. Record those costs separately. For a small brand team in Dubai or elsewhere in the Middle East, a short report with clear definitions is more useful than an impressive total that nobody can explain.
1. Choose the question before the campaign
Write one main question, such as whether a demonstration makes assembly easier to understand, or whether a particular invitation sends observable visits to a specification page. “Awareness, engagement and sales” combines several jobs without explaining how the team will judge this particular experiment.
Pair the question with a main measure and an interpretive signal. For product understanding, you might review recurring questions and points of confusion. For website traffic, you might examine recorded campaign-link visits and available information about those visits. Agree what information creators will share beforehand, including timing. Build the report around data you can actually obtain.
2. Separate delivery, attention and action
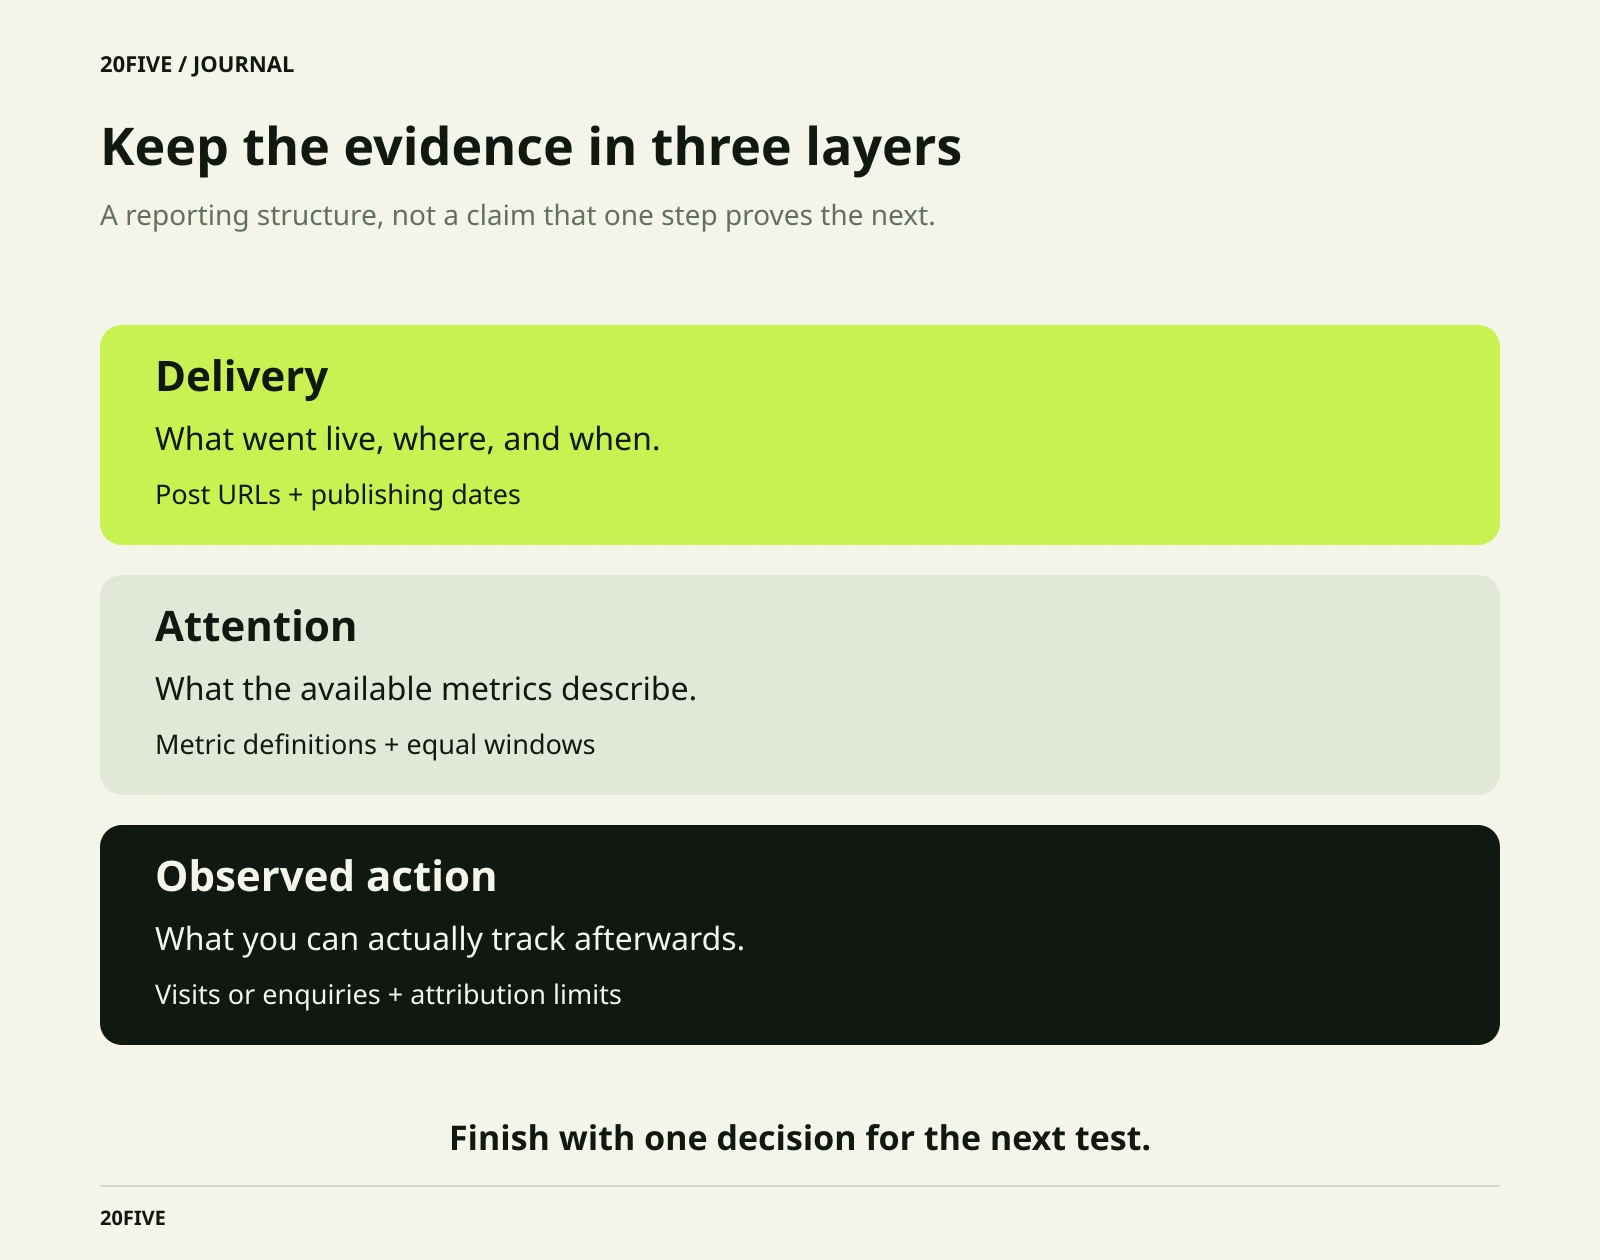
First establish what was delivered: which pieces went live, on which accounts, and when. Then record available attention signals, using the platform’s own metric names. Finally, record observable subsequent actions, such as website visits or enquiries, without quietly turning those actions into something more consequential.
Do not assume every view represents a different person. Adding views across several posts does not produce a deduplicated audience count. A comment asking about price is useful evidence of a question, but it is not a completed purchase. These distinctions matter more than the visual polish of the report.
3. Compare consistent observation windows
Choose a rule, such as recording each post seven days after publication, and identify it as your team’s measurement window for this experiment. Comparing a one-day-old post with a month-old post gives one much longer to accumulate activity. Save the extraction date because the figures may change later.
Keep the context beside the numbers: language, intended market, format, length, publishing date and any additional paid distribution. An Arabic demonstration for a specific local audience and an English entertainment video for a wider audience answer different needs. Compare them only where the comparison can meaningfully answer your original question.
4. Define every calculated rate
If you calculate an engagement rate, state both the included actions and the denominator. Did you add likes, comments and shares? Did you divide by views, reach or followers? Use the same definition across the rows you compare, rather than mixing rates copied from different tools or creator screenshots.
Mark unavailable information as “not available,” not zero. Zero is an observed result; missing information is a limit on interpretation. Where volumes are small, show the underlying count beside a percentage. That makes it easier to see whether an apparently dramatic change reflects only a few additional actions.
5. Prepare the website links in advance
If visits are the goal and the selected publishing placement supports links, agree consistent campaign and content names. Google’s documentation explains that UTM parameters help identify campaigns referring website traffic. Test the destination and measurement setup before publication. Google’s campaign-link guide
Use content identifiers rather than personal information in those links, and retain the approved URL for each placement. Tagged links help interpret recorded visits. They do not reveal every person who saw a video and returned through another route or device. Keep that limitation visible when presenting the findings.
A hypothetical example: what can the report actually say?
Imagine a campaign demonstrating a desk lamp. The team sees recurring questions about the direction of the light and records visits through a video link. It has not established a reliable connection between those visits and purchases. A useful conclusion is: “We recorded campaign-link visits, and the next demonstration should show the lamp’s adjustment more clearly.”
Assigning a sales figure or return on investment to those signals alone would go beyond the available evidence. If sales measurement is needed next time, define the attribution approach, included costs and limitations before the next experiment. Keep observed facts, interpretations and future tests separate.
Your report checklist
- Is the main question explicit, and do the measures answer it?
- Does every post have a URL, publication date and measurement window?
- Are metric definitions and calculated rates consistent?
- Are observations separated from estimates and unavailable information?
- Have you recorded costs without assigning invented monetary values to views?
- Does the report end with one specific action for the next experiment?
Finish with a decision: reshoot a confusing step, improve the product page, or test a clearer invitation. A useful report reduces guesswork in the next project, even when its most honest finding is that the current evidence cannot settle the question.
Related reading
Take the next step
Explore the relevant 20Five pathway and discuss a clear scope before taking the next step.
More from the journal.

How to write a creator gifting brief before shipping the product
A product cannot explain the assignment on its own. Use this template to agree content, timing, publishing and rights before it ships.
Read the guide
How to keep self-filmed UGC clear and useful
Natural, clear content starts before recording. Use simple checks for sound, image and message accuracy before the final handover.
Read the guide
How to choose the right creator for your brand
Follower count cannot answer every question. Review audience relevance, presentation style and production fit before building your shortlist.
Read the guide